liman-tech
← All industries
Cross-industry solution

Energy Efficiency

Cut your plant's energy bill — metering, specific-consumption norms and verified savings. From an energy audit to energy performance contracting (ESCO): pay out of what you save, with no upfront investment.

Strongest combination
Metering + baselining + energy performance contracting (ESCO)

This mix delivers the most on the industry's key process stages. Details in the cards below.

Key equipment
Blast-furnace blowersOxygen plants (ASU)Sinter plant (exhausters)Electric arc furnaces (EAF) and ladle furnaceRolling-mill reheat furnacesCompressor houses (compressed air)Pumps and fans (VFD)Boiler houses and steam linesTransformers and grids (power factor / cos φ)
−3–8%
energy spend with no capital outlay
submetering, baselines and discipline alone — no equipment replacement
−20–50%
on a unit with a VFD
pumps and fans: a VFD instead of throttling with a damper
−10–30%
on compressed air
leaks eat 20–40% of output; every extra bar of pressure adds ~7% more
< 2 years
payback on metering measures
often 6–12 months; under an energy-performance model — no outlay at all

These are typical industry ranges; your actual potential is shown by an energy audit and an on-site baseline.

By area

Where the losses hide — area by area

Energy losses stay invisible until you have instrument-level metering: motors running flat out behind a half-closed damper, compressed-air leaks, power-factor penalties, heat going up the stack. We make the losses measurable — keep a finger on the pulse of your asset’s energy flow.

1

Electric drives: pumps, fans, compressors

Where
Electric motors consume 60–70% of a plant’s electricity — the single largest savings reserve
Metering Passer-T on the motor supply lines: it meters energy and watches drive condition at the same time — one device, two effects.
VFD A variable-frequency drive (VFD) instead of a damper: halve the speed and the power drops eightfold. We measure the real load and calculate the payback.
Effect: −20–50% of a unit’s electricity once it moves to a variable-frequency drive.
2

Compressed air

Where
Compressor rooms, mains, consumers — the most expensive energy carrier per unit of useful work
Leaks Leaks bleed off 20–40% of the air produced. Metering by branch shows exactly where.
Pressure Every extra bar costs about 7% of the energy. We set the working pressure right and recover compressor heat.
Effect: −10–30% of compressor-station energy.
3

Steam and boiler houses

Where
Boiler houses, steam lines, heat exchangers, condensate lines
Metering Meters on steam lines and branches — you see how much each stage draws.
Condensate Condensate return, insulation condition, losses from flash steam.
Effect: Fewer steam losses — less boiler-house fuel.
4

Electric arc furnaces (EAF) and reheat furnaces — the flagship

Where
An electric arc furnace is the largest consumer at a metallurgical plant: 350–550 kWh per tonne of steel (the best shops — 360–400)
kWh/t We track specific consumption per heat — "expensive" heats and their causes show up at once.
Slag Slag foaming (foamy slag): the foam layer shields the arc and conserves heat — −5–15 kWh/t plus electrode life.
Off-gas heat We preheat scrap with off-gas heat that would otherwise go up the stack — down to −60–90 kWh/t.
Effect: An energy model of the shop — a ready justification for an energy-performance contract. We do not interfere with arc control.
5

Reactive power and networks

Where
Transformers and networks: the utility charges penalties for a low power factor (cos φ)
cos φ Continuous monitoring at incomers and shops — you see which equipment is "spoiling" the network.
Compensation Justification and selection of capacitor banks — supplied as a subcontract.
Effect: Penalties removed, networks and transformers unloaded.
6

Metering and baselines — the foundation of it all

Where
The whole plant: energy balance, shops, stages, shifts
Baseline An energy baseline: your reference consumption over 12 months, corrected for output and weather — the point savings are measured from.
kWh/t Specific consumption (EnPI) by shop and stage — overruns show up by shift, not in the annual report.
CUSUM A cumulative "actual minus norm" chart: when savings or overruns started and how much has built up.
Effect: −3–8% with no capital outlay; the foundation for energy performance contracting and ISO 50001.
Strongest combinations

Where combined methods multiply the effect

Pumps and fans
Variable-frequency drive (VFD)
Match speed to load instead of throttling with a damper: halve the speed and you cut the power eightfold. Result: −20–50% on the unit.
Compressed air
Leaks + pressure
Leaks bleed off 20–40% of output; every extra bar of pressure adds roughly 7% more energy. Result: −10–30%.
Electric arc furnaces (EAF)
Norms + slag foaming
Track consumption per heat; foamy slag shields the arc and conserves heat — −5–15 kWh/t plus longer electrode life.
EAF: scrap preheating
Off-gas heat recovery
Preheat scrap with heat that would otherwise go up the stack — up to −60–90 kWh/t.
Integrated steel mill
Blast · oxygen · sinter · furnaces
An integrated mill with no arc furnaces: we baseline blast-furnace blowers, ASU oxygen (m³ per tonne of steel), sinter-plant exhausters (VFD) and rolling-mill reheat furnaces.
Oxygen plants (ASU)
Oxygen consumption norm
The ASU is one of the mill's largest electricity consumers; we baseline m³ of oxygen per tonne of steel and the compressors' energy. The headroom lies in eliminating excess output.
On-site generation (blast-furnace gas)
Energy balance + peak shaving
Account for the blast-furnace and coke-oven gas balance at your own power plants, optimize distribution and shave peaks (peak shaving): peak demand is billed separately from kilowatt-hours.
Grids and transformers
Reactive-power compensation (cos φ)
Drop the utility penalties for a low power factor and unload the grid.
The whole plant
Metering + baselining
−3–8% on energy costs with no capital outlay — just metering, norms and discipline.
What we offer

Three rollout levels — pick by maturity

Level 1

Energy audit and metering

Make the losses visible

Stack
Larus (meter polling) + Passer-T (per-motor metering) + a dashboard on Strix
Level 2

Baselining and energy management

Consumption norms, ISO 50001 / Federal Law 261-FZ

Stack
Strix EnMS (norms, deviations, reports) + LimanISU (the energy manager's workstation)
Level 3

Turnkey energy performance contracting (ESCO)

Savings with no investment

Stack
Metering + baselining + measurement & verification (M&V) of savings: pay out of what you save

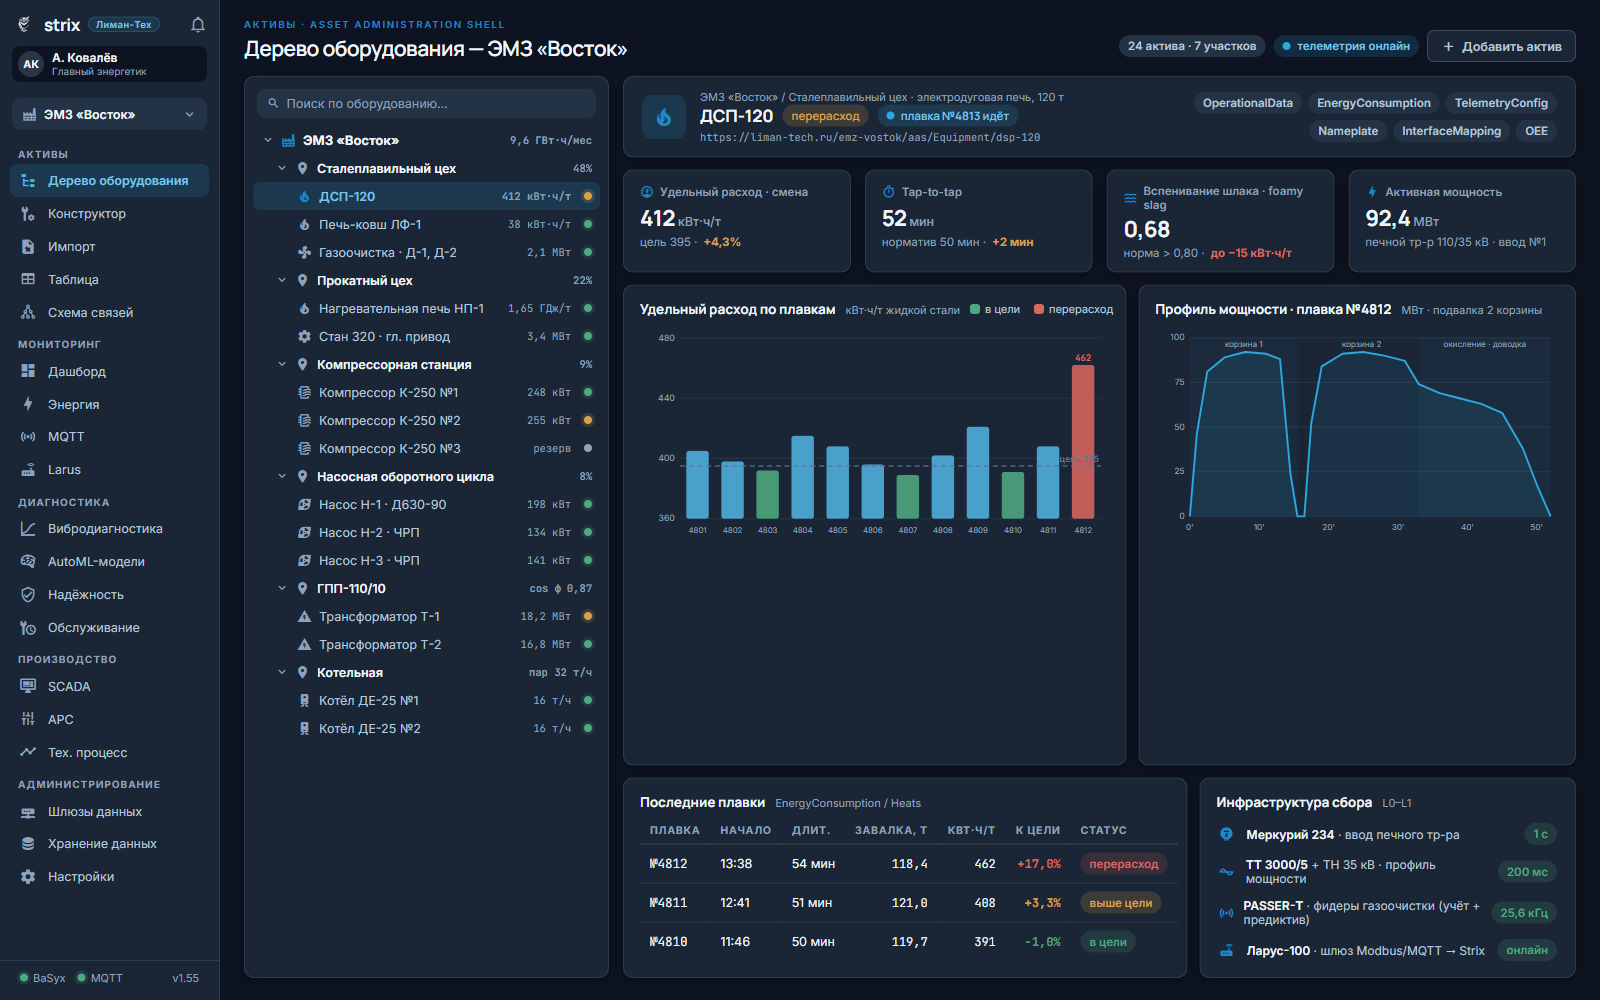
Where this section sits on the site map. Power generation is about how energy is produced: thermal and hydro plants, turbines and boilers. This section is about how to stop overpaying for it on the shop floor: metering, baselining and verified savings at any plant. For diagnostics of metallurgical equipment (vibration and current on furnaces, rolling mills, cranes), see the Metallurgy section — there the same arc furnace is viewed from the other side: how much energy it spends per tonne of steel, rather than how its bearings are feeling.

Two metallurgy archetypes. Electric steel (arc furnace) and the integrated steel mill — we cover both. An integrated mill has no arc furnaces: there we baseline blast-furnace blowing, oxygen, sinter, rolling-mill reheat furnaces and on-site generation on blast-furnace gas — right down to shaving demand peaks, which are billed separately from kilowatt-hours.

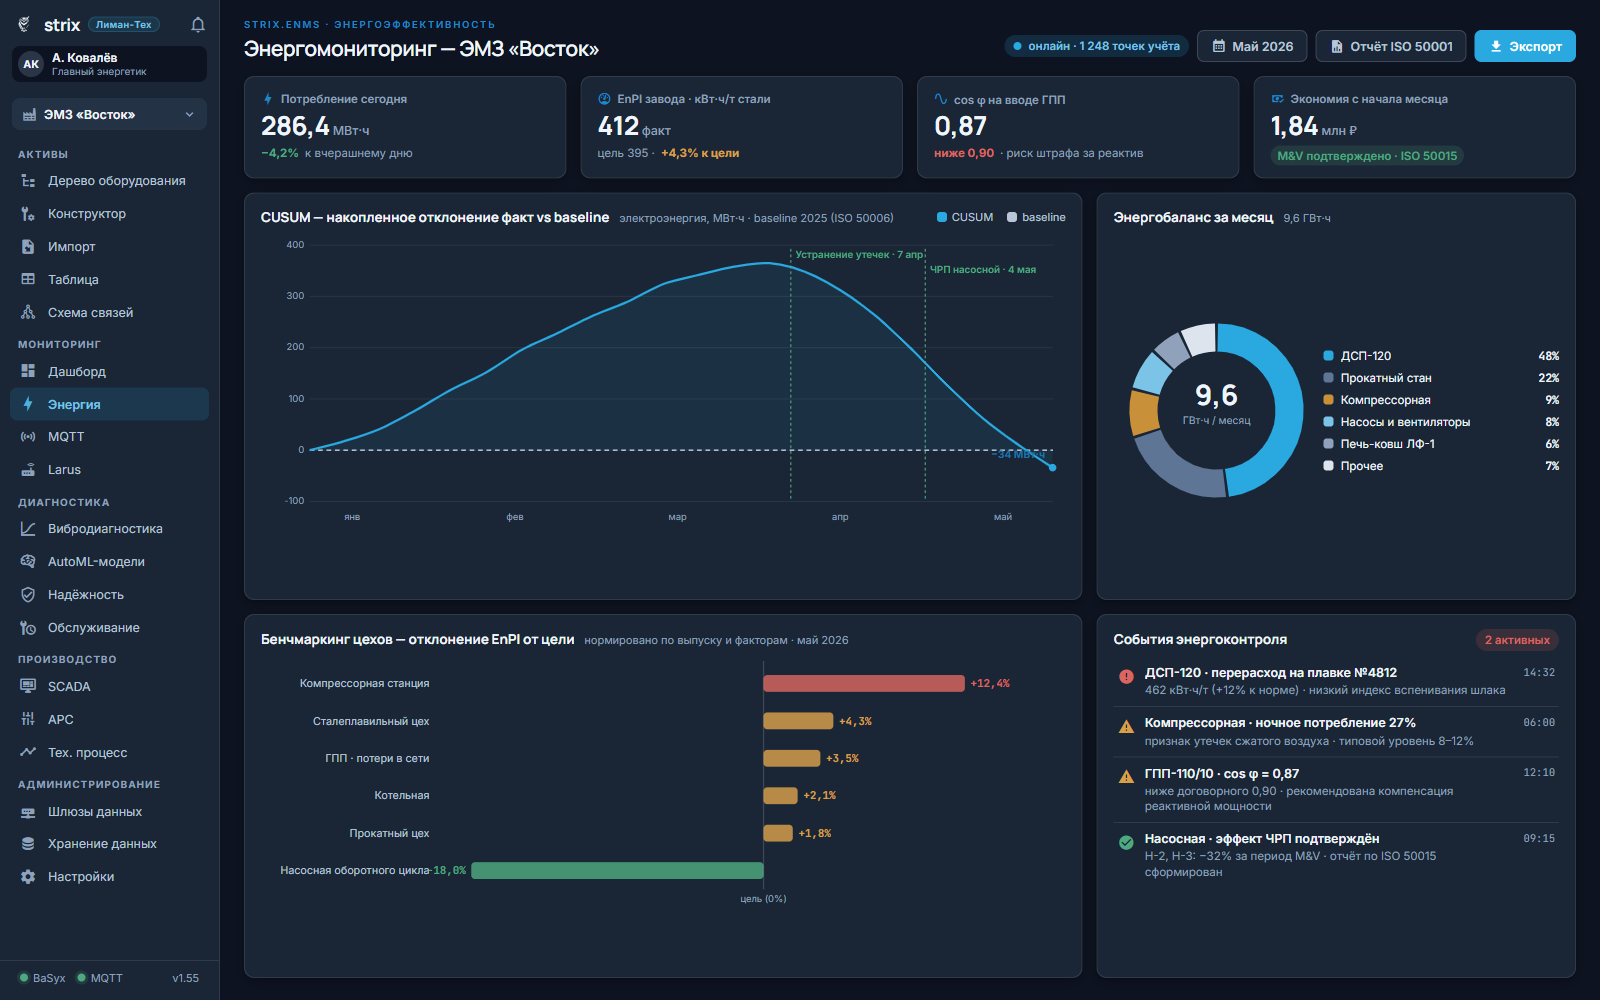
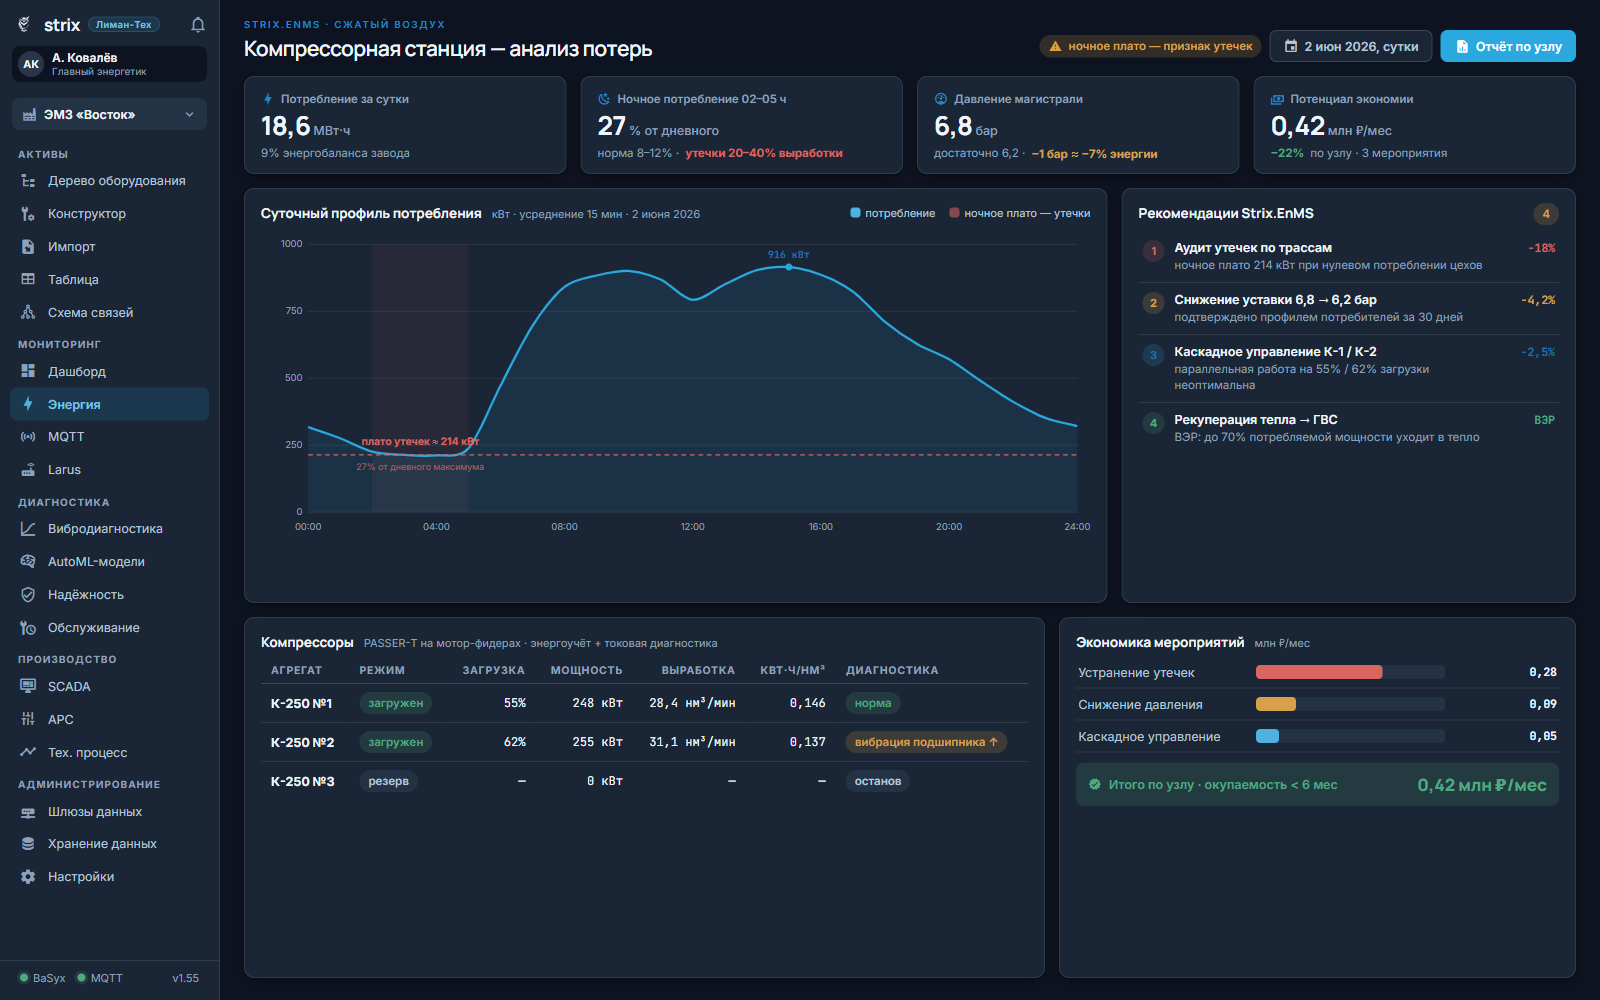
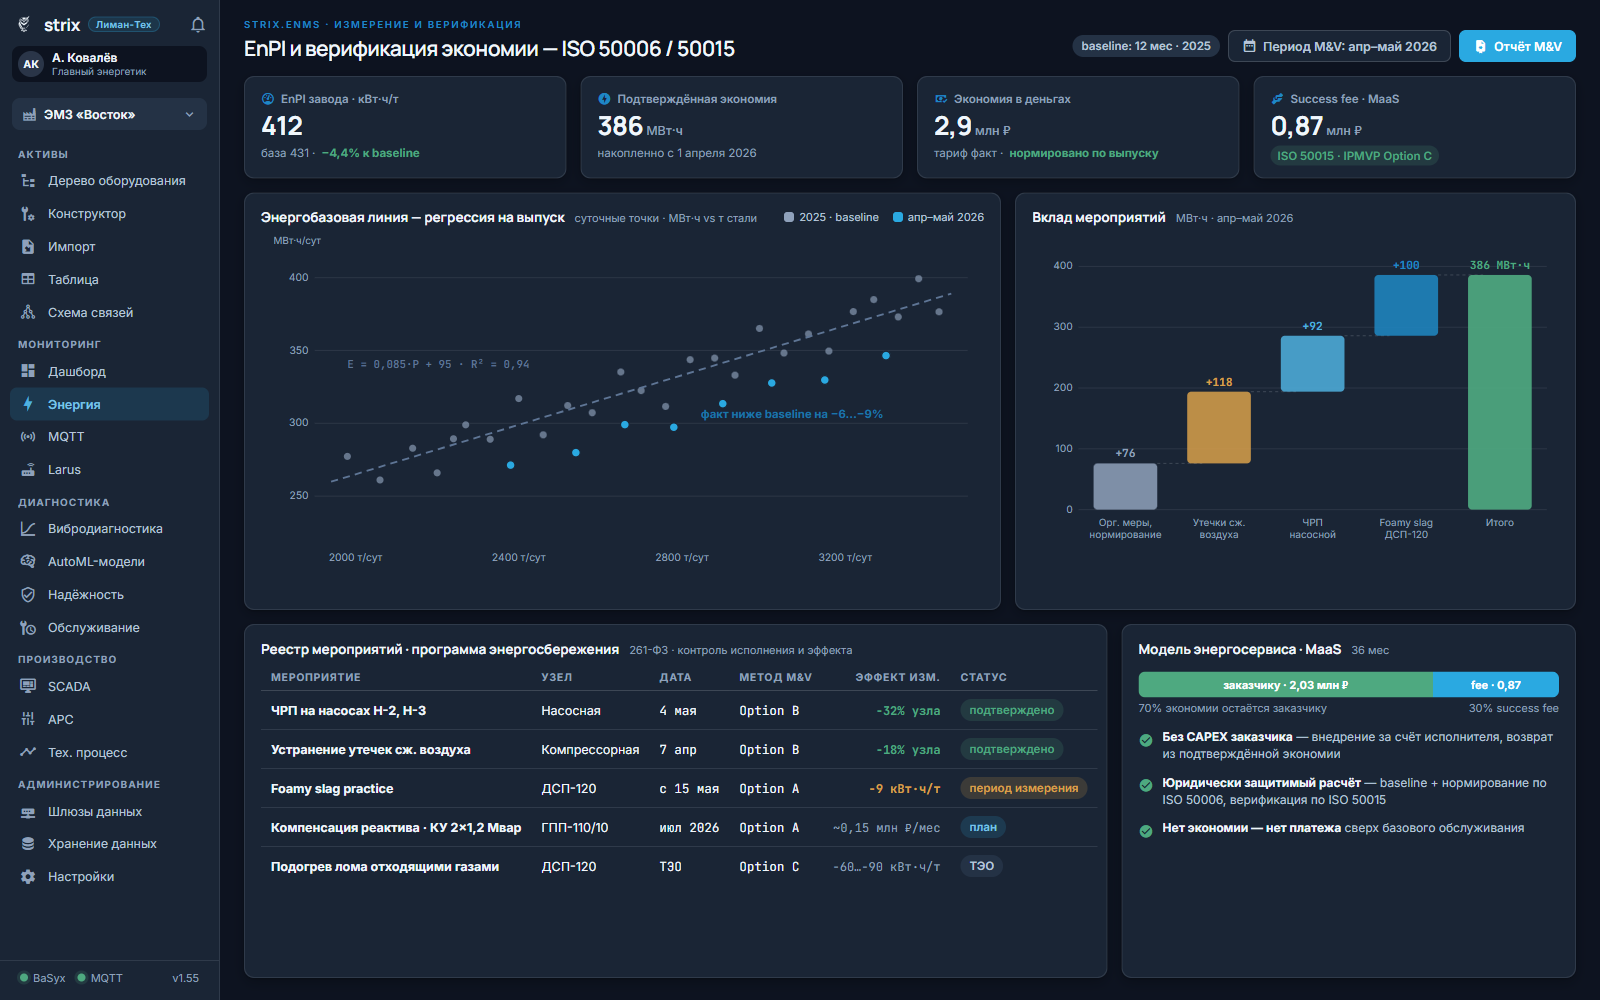
Our principle: measure, baseline, verify the savings. We don’t sell hardware for its own sake — power equipment (variable-frequency drives, capacitor banks, heat-recovery units) is specified and supplied as a subcontract, while we stay accountable for a measurable result: the rationale, the management and the verification of savings under the international M&V methodology (ISO 50015). That’s why energy performance contracting, where our fee depends on your savings, is a natural way for us to work — not a marketing line.

How it works

Keep a finger on the pulse of your asset’s energy flow

Energy is the most manageable cost line at a plant — but you can only manage what you measure continuously. From the meter to the executive screen — four steps.

1

Meters — the pulse monitor

Electricity meters, heat sensors and flow meters for steam, gas and air. Passer-T on the motor supply lines meters energy and watches drive condition at the same time. Connection — with no production stoppage.

2

Data collection — Larus

Larus polls the meters over existing communication lines, buffers and forwards the data. We do not replace your existing commercial metering (utility metering system) — we connect it as one of the sources.

3

Strix — the cardiogram

It compiles the energy balance, computes baselines and specific consumption, and compares actual against the norm by shop and shift. Overruns show up the day they happen, not in the annual report.

4

Energy engineer’s screen — the dashboard

LimanISU: the chief energy engineer’s workstation and an executive summary screen, with automatic reports for ISO 50001 and the Russian energy-efficiency law (261-FZ). Everything runs on-premise; the software is in the Russian software registry.

What it looks like

The energy engineer’s workstation in Strix

The interfaces are real, the data is for demonstration (a fictional plant). Swipe through: from the overall energy balance to savings verification.

Strix: Plant energy monitoring
Plant energy monitoring. Cumulative savings chart (CUSUM), monthly energy balance, shop-to-shop comparison by specific consumption, and energy-control events.
Strix: Equipment tree and heats
Equipment tree and heats. Specific consumption per heat — "expensive" heats highlighted; alongside, the power profile and shift history.
Strix: Compressor room — loss analysis
Compressor room — loss analysis. Daily consumption profile: leaks show up as the night-time baseload "shelf". Recommendations and savings by measure.
Strix: Savings verification (M&V)
Savings verification (M&V). Baseline corrected for output (ISO 50006), the contribution of measures, and the calculation for the energy-performance model.
Credible savings

How we verify savings

To get paid out of savings, you have to count them honestly. Five steps following the international methodology (ISO 50006 / ISO 50015) — from baseline to a legally meaningful calculation.

1

Baseline

An energy baseline — your reference consumption over 12 months. Savings are measured from it.

2

A fair comparison

Baselining — correcting for output volume, weather and product mix, so you compare like for like.

3

The target number

Specific consumption (EnPI) — kWh per tonne of product for each shop and stage.

4

The moment of savings

CUSUM — a cumulative "actual minus norm" chart: when savings started and how much has built up.

5

Verification

M&V — measurement & verification per ISO 50015: a legally meaningful savings calculation that pay-for-results is based on.

Glossary

The terms on this page — in plain words

These same words will be in our report and contract — let them not be daunting.

VFD

Variable-frequency drive: it adjusts motor speed to the load — instead of running flat out behind a half-closed damper.

EnPI

Specific energy consumption: how many kWh go into a tonne of product. The headline number we watch.

Baseline

Energy baseline: reference consumption over 12 months — the point against which savings are measured.

CUSUM

A cumulative "actual minus norm" chart. It shows when savings (or overruns) started and how much has built up.

M&V

Measurement & verification: a methodology for honestly confirming savings per ISO 50015.

ESCO

Energy performance contract: the contractor invests up front and recovers the money out of verified savings (261-FZ, ch. 5).

Utility metering

Commercial metering for settlement with the utility. It answers "how much to pay", not "where we lose it".

cos φ

Power factor: the share of "useful" power in the network. The utility charges penalties for a low value.

From practice

Instrument-level metering — our foundation since 2018

For a large pipe plant we built an automated energy-resource monitoring and metering system — the instrument-level basis for managing the plant’s energy use. For the operator of high-voltage transmission networks we delivered electricity-metering projects (utility metering systems) at 35–750 kV substations across several regions of the country.

Proven track record
  • Energy-resource metering for pipe production — delivered and signed off, 2018
  • Electricity metering at 35–750 kV substations — projects 2018–2022
  • Today analytics runs on top of the metering: baselines, deviations, savings verification
How to buy

Three commercial models

From outright purchase to energy performance contracting, where you pay out of what you save.

CAPEX — purchase

You buy the equipment and software outright — all the savings are yours. Transparent and familiar; for critical-infrastructure sites — the only option.

ESCO — energy performance contracting

We and a financial partner invest up front, with recovery out of verified savings (261-FZ ch. 5; for public procurement — 44-FZ art. 108). For you — no up-front outlay.

MaaS — subscription

A monthly base fee + a percentage of verified savings (calculated per ISO 50015), over a 36-month term. The result risk is on us: no savings — no payment beyond the base.

In a minute

Find out where you overpay for energy

Answer four questions — a manager will come back with specifics: where your typical losses are, the first step, and the order of savings. No obligations.

  • We’ll estimate the potential against industry benchmarks
  • We’ll show the order of savings and the payback period
  • No outlay wanted — we’ll propose ESCO / MaaS
1. Industry / type of production
2. Scale of energy consumption
3. Main objective (several allowed)
4. Energy metering today
Refine the savings estimate (optional)

If you know — we’ll show the order of savings and the payback period. If not — we’ll estimate against benchmarks.

FAQ

What people usually ask

We already have a utility metering system — why you?

A utility metering system is commercial metering for settlement with the utility: it answers "how much to pay". We build an analytics layer on top: specific-consumption baselines by shop and stage, detection of overruns, shop-to-shop comparison, savings verification. We do not duplicate your metering — we connect it as a data source.

What is the payback?

Organisational and metering measures — usually under 2 years, often 6–12 months. Technical ones (variable-frequency drives, reactive-power compensation, heat recovery) — 1–3 years. Under energy-performance models (ESCO / MaaS) — no up-front outlay: you pay out of the savings already achieved.

We have already had an energy audit — we got a report volume for the shelf.

A one-off audit is a "snapshot" at the moment of the survey. We provide continuous verification: the system constantly measures, baselines, and shows savings or overruns in real time (a cumulative savings chart — CUSUM), and runs a measures programme with execution tracking. An audit says "here is the potential"; our system says "here is the actual, verified result".

Do you install VFDs / modernise furnaces?

Power equipment (variable-frequency drives, capacitor banks, heat-recovery units) we select and supply as a subcontract. Our competence and responsibility — to measure, justify by calculation, manage and verify the effect. This protects you: we are interested in real savings, not in selling hardware.

What will you give the meltshop? The arc is controlled by the furnace regulator.

We do not interfere with the furnace control system — that is the safety and quality loop. Our layer is above it: we count the consumption of each heat, find "expensive" heats and their causes, monitor slag foaming via the electrical parameters of the arc, account for the effect of scrap and ladle-furnace preheating, and assess the heat-recovery potential. The result is an energy model of the shop, ready for an energy-performance contract.

Why do we need ISO 50001? We already have an energy department.

ISO 50001 is the energy-management system standard: instead of one-off campaigns — a continuous cycle of "measure → baseline → improve". Certification is increasingly required by holdings, export contracts and ESG reporting, and it also covers the obligations under the Russian energy-efficiency law (261-FZ) (energy declaration, energy-saving programme). Our system automates data collection and reporting — the energy department works on solutions, not on reconciling Excel.

Consumption data is sensitive information. Where is it stored?

The whole complex runs inside your perimeter, on your equipment (on-premise). No mandatory clouds or foreign services. The application software (LimanISU) is in the Unified Register of Russian Software. Access — under your information-security policies.

Why energy performance contracting rather than just selling the system?

We can sell it too (the CAPEX option) — the choice is yours. But the "pay from savings" model means the result risk is on us: no savings — no payment beyond the base. This is possible because our verification methodology (M&V per ISO 50015) gives a legally meaningful calculation of the actual savings. For energy efficiency, it is the most honest model.