Executive Dashboard
What the asset is earning right now and where the money leaks: a loss waterfall in money, plan / actual / forecast, site comparison — on the owner's and CFO's phone, with no retellings and no manual reports.
This mix delivers the most on the industry's key process stages. Details in the cards below.
Where combined methods multiply the effect
Three rollout levels — pick by maturity
Dashboard on your data
Process control system, meters, MES already in place
Dashboard + monitoring
Adding telemetry where there is none
Management by effect
Plan / actual / forecast, verified savings
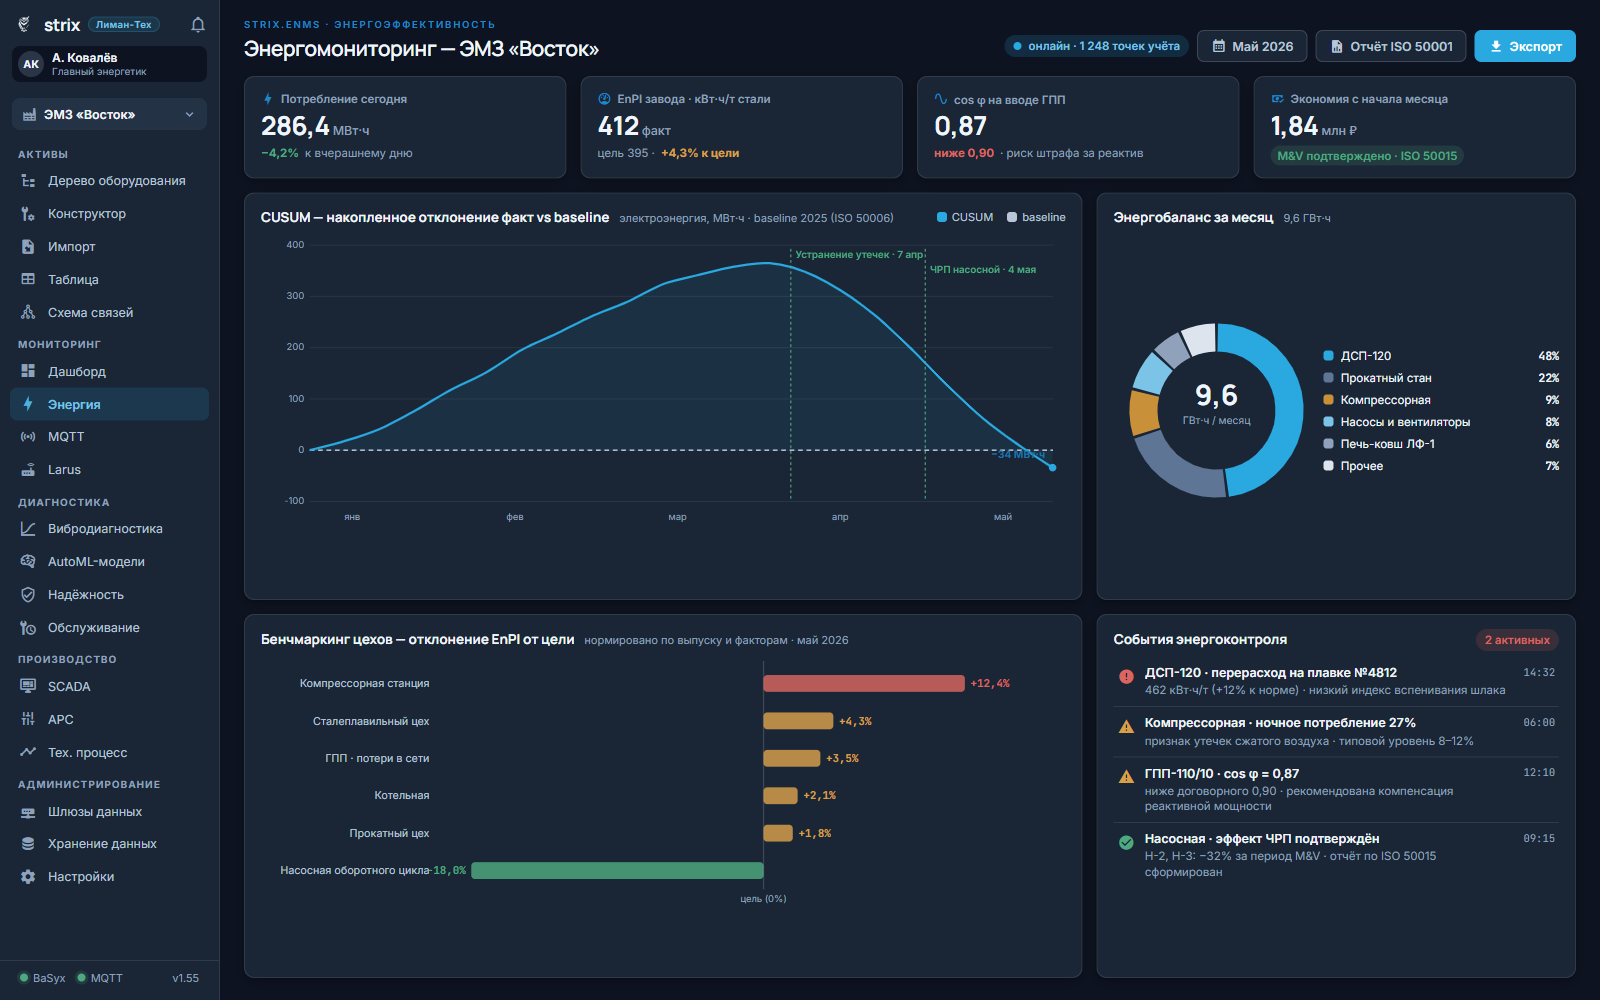
Why. Reports are assembled by hand once a month, every department has its own numbers, and the effect of measures goes unconfirmed. The executive dashboard turns physics into money continuously: one data model — one source of truth for the owner, the CFO and the chief engineer. Keep a finger on the pulse of your asset — literally, from your phone.
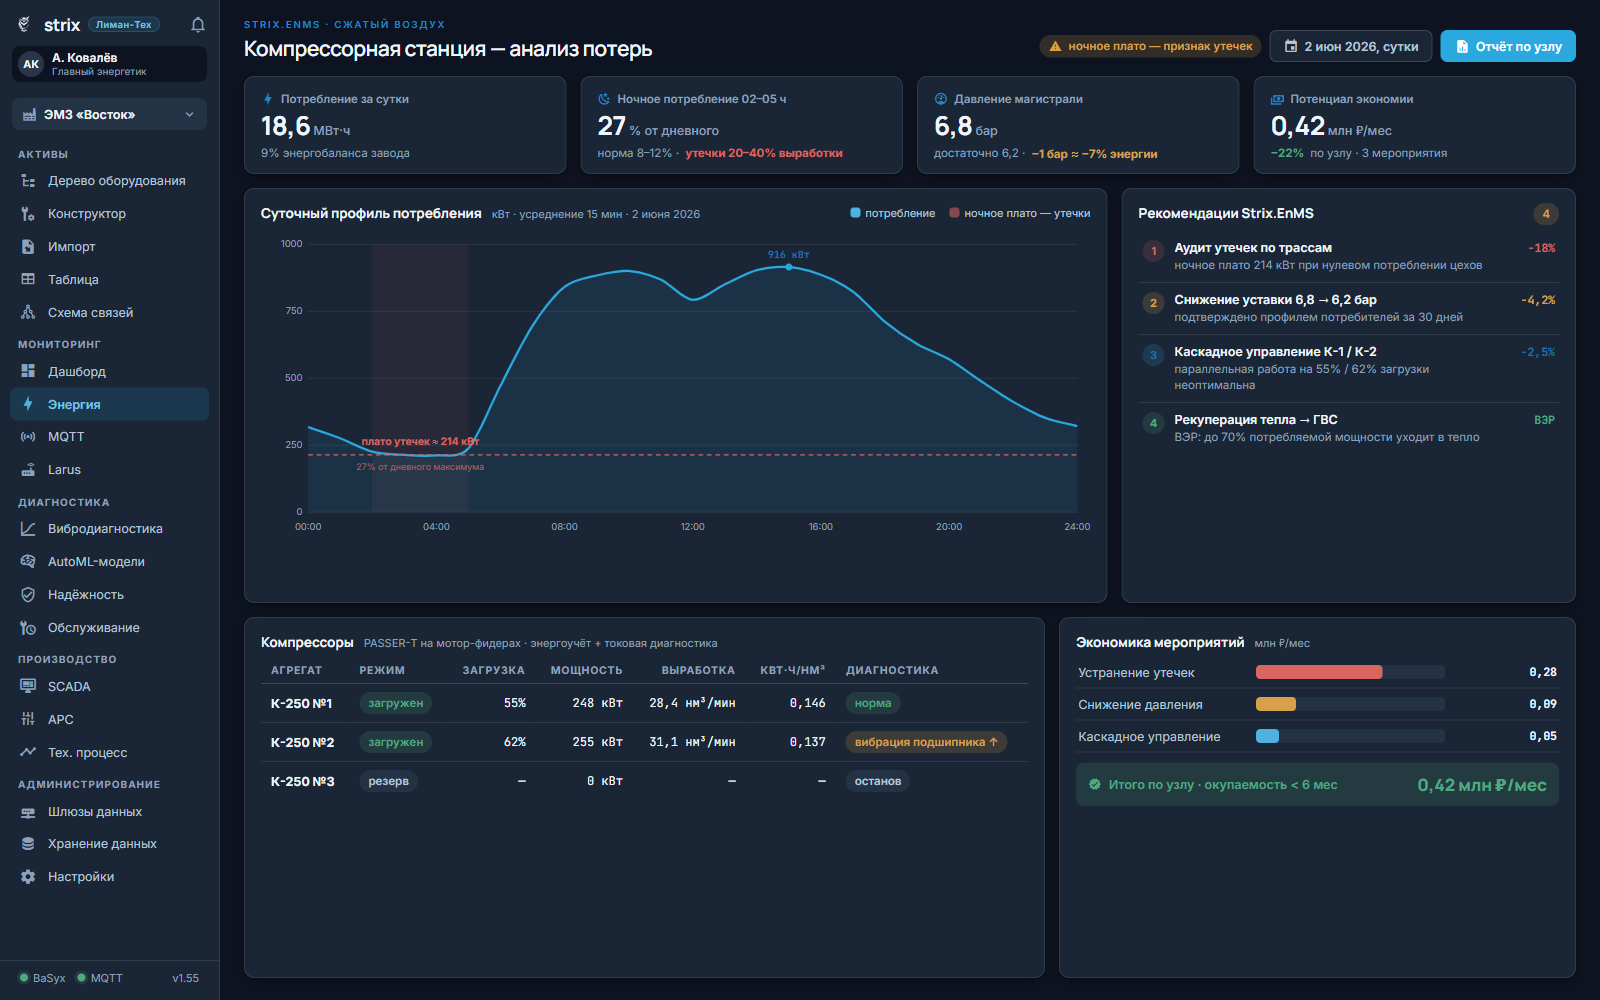
The loss waterfall. Potential revenue → unplanned and planned downtime → speed losses (running below rated capacity) → process losses → quality (scrap, rework) → excess energy → actual revenue. Every step — in money, on live telemetry. OEE, MTBF and specific consumption aren’t percentages for their own sake but lines in money.
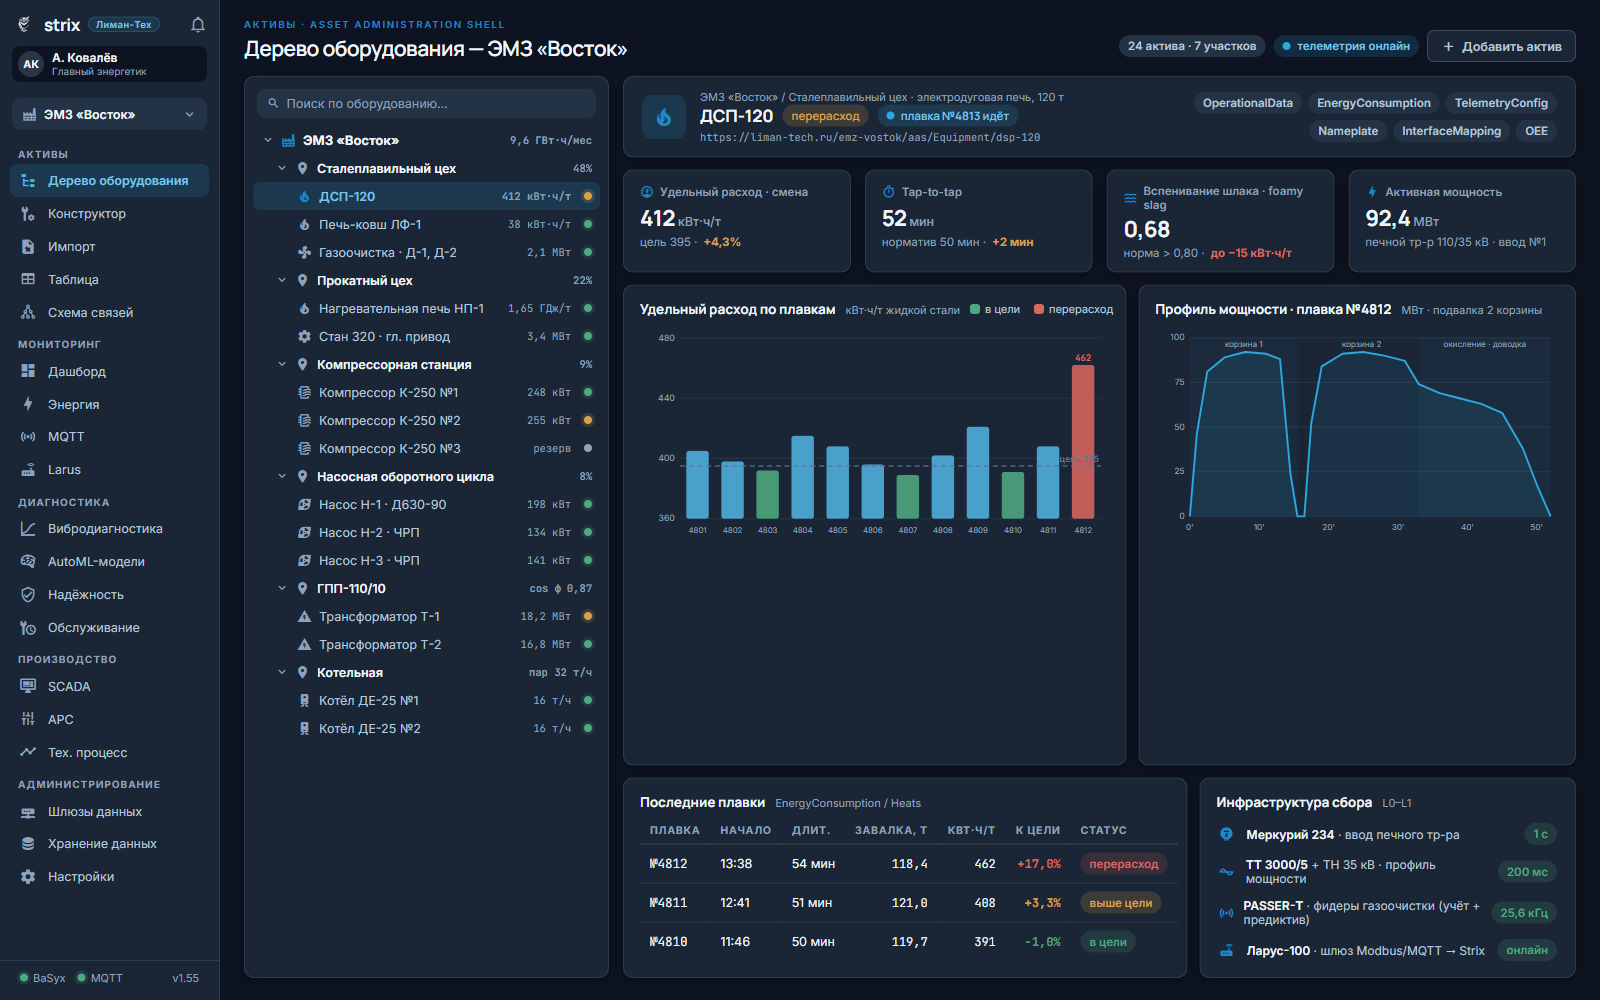
Where the data comes from. The dashboard is built on top of any maturity level: existing process control systems, meters and MES are polled by Larus; where there’s no telemetry, Passer and its sensors add it. The economic model and the dashboard run on Strix, the platform’s delivered financial module.
Results in numbers
- Unplanned downtime costs large producers up to 11% of revenue (Siemens estimate, 2024)
- The cost of an hour of downtime for your mill, furnace or line — we compute it from the site’s parameters during the survey
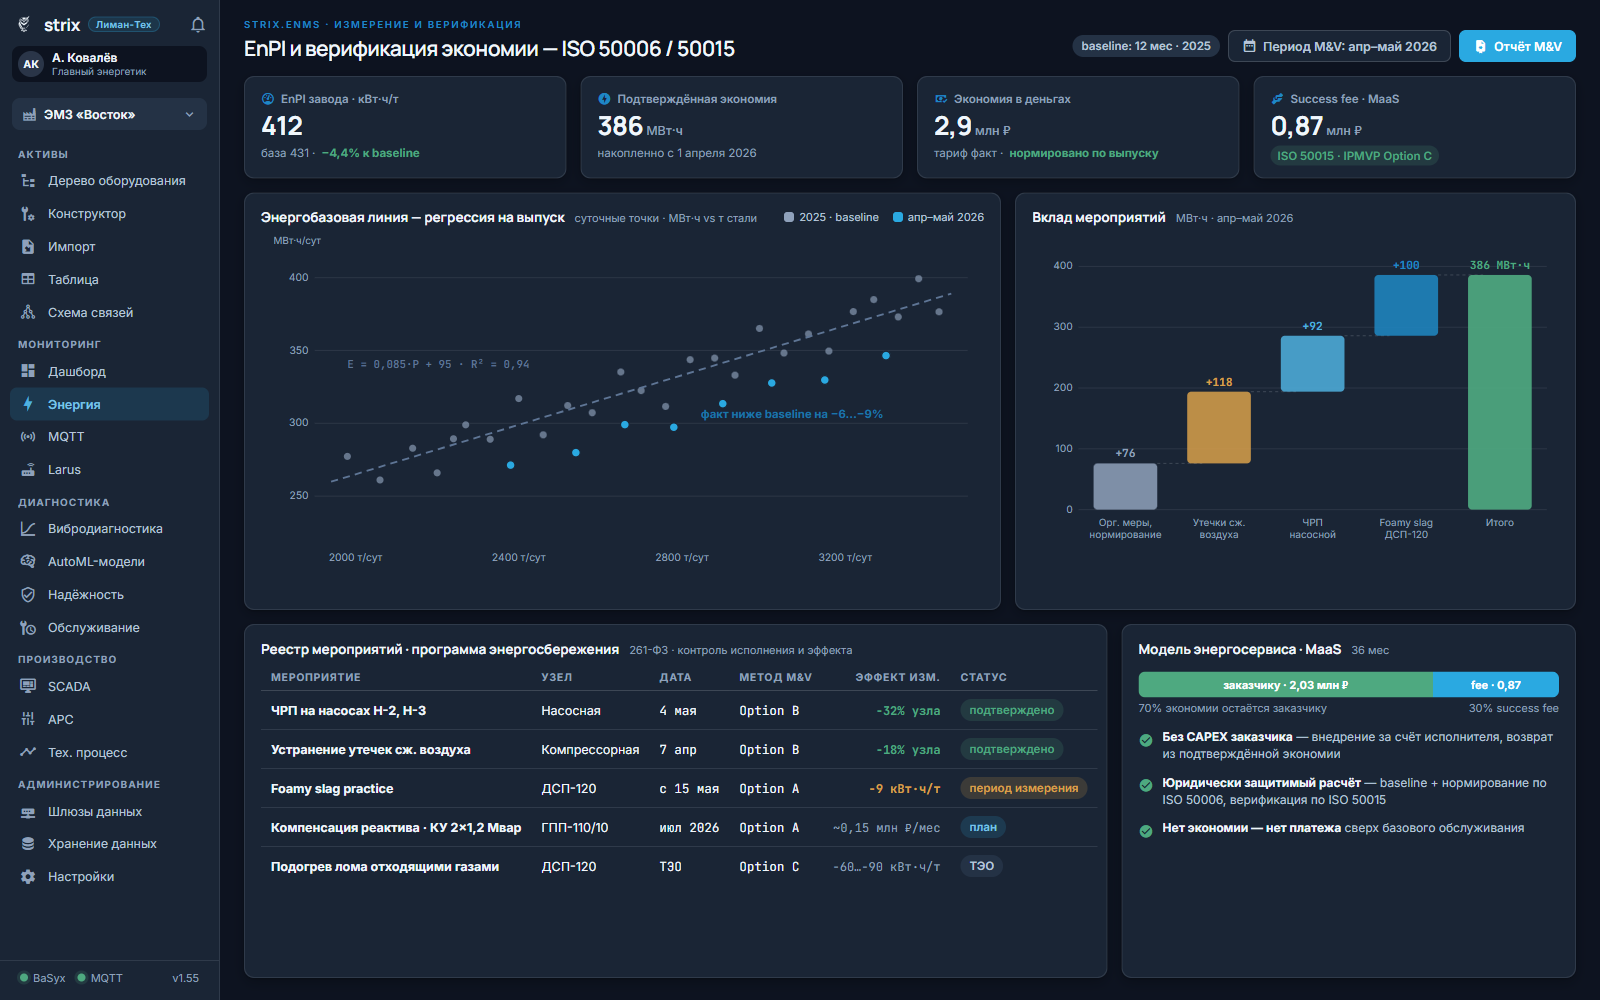
- The effect of measures is verified with the M&V methodology — MaaS and ESCO models are built on this, where our fee depends on your savings
The dashboard is a transparency tool: it doesn’t promise percentages — it shows you where they are.
Related solutions: equipment diagnostics — the engineering foundation of the dashboard; energy efficiency — metering, baselining and measurement & verification (M&V) of savings.
The executive view in Strix
The interfaces are real, the data is demo. Swipe through: the asset's financial picture, fleet reliability, verified savings.
Three commercial models
From outright purchase to a service model where you pay out of verified savings.
CAPEX — purchase
You own the hardware and software — the full effect is yours. Transparent and familiar; for critical infrastructure it is the only option.
MaaS — subscription
Monitoring-as-a-Service: 36 months, a monthly base fee plus a share of the verified effect. The performance risk is ours — no effect, nothing beyond the base.
ESCO — energy performance contract
Energy-saving measures with no capital outlay on your side: we invest, repayment comes out of verified savings.
Find out where your money leaks
Downtime, speed, process, quality, energy — tell us about your site and a manager comes back with specifics: what data you already have and how fast the dashboard can be live.
- We match the method mix to your equipment
- We size the pilot and give you ballpark figures
- We reply within one business day
Request received. Thank you!
A manager will get back to you within one business day with a concrete first step for your fleet.